

Every sales meeting eventually arrives at the same question: what will we actually close this quarter? In most companies the answer is assembled by hand the night before — a rep's gut feeling poured into a spreadsheet, then optimistically rounded up. It is slow, it is biased, and by the time it is finished it is already out of date.
Skyline Sales OS answers that question continuously and from real data. Because every lead, deal and quote already lives in the system, the analytics build themselves — there is no separate reporting chore, just a live read of the business you can open any time.
The core metrics, built automatically
- Funnel. How many deals sit at each stage, so you see where volume bunches and where it thins.
- Conversion. The rate at which deals move from one stage to the next, exposing the exact step where deals stall.
- Win-rate. The share of qualified deals you actually close — the honest measure of effectiveness.
- Velocity. How fast deals move through the pipeline, so you can spot a process that has slowed before the quarter ends.
- Rep leaderboard. Who is converting, who is quoting, who is at risk of missing — visible to the whole team.
None of these require a report to be written. They are a side effect of working the pipeline honestly.
The weighted forecast: an honest number, not a hopeful one
A raw pipeline total is fiction — it assumes every open deal closes. A weighted forecast multiplies each deal by its real win-probability, so a 200,000 SAR deal at 30% counts as 60,000 toward the number. The result is a forecast grounded in likelihood rather than optimism, and because the probability comes from the same AI your reps already see on each card, sales and finance finally argue from one figure instead of two.
The forecast also moves on its own. When a deal advances, a quote is accepted, or a deal rots, the weighted number updates — so the forecast you open on Wednesday reflects Wednesday, not last Thursday's snapshot.
Quotas versus attainment, by territory
Targets only mean something when you can see progress against them in real time. Skyline Sales OS tracks quotas against attainment — each rep and team measured against their number as the quarter unfolds, not totted up at the end. And it does this by territory, so a group selling across Riyadh, the Eastern Province and the Western Region can see which territory is ahead, which is behind, and where to move effort before the gap is unrecoverable.
| Metric | Question it answers |
|---|---|
| Funnel | Where do deals pile up? |
| Conversion | Which stage leaks? |
| Win-rate | How effective are we? |
| Velocity | Are we slowing down? |
| Weighted forecast | What will we really close? |
| Quota vs attainment | Are we on target, by rep and territory? |
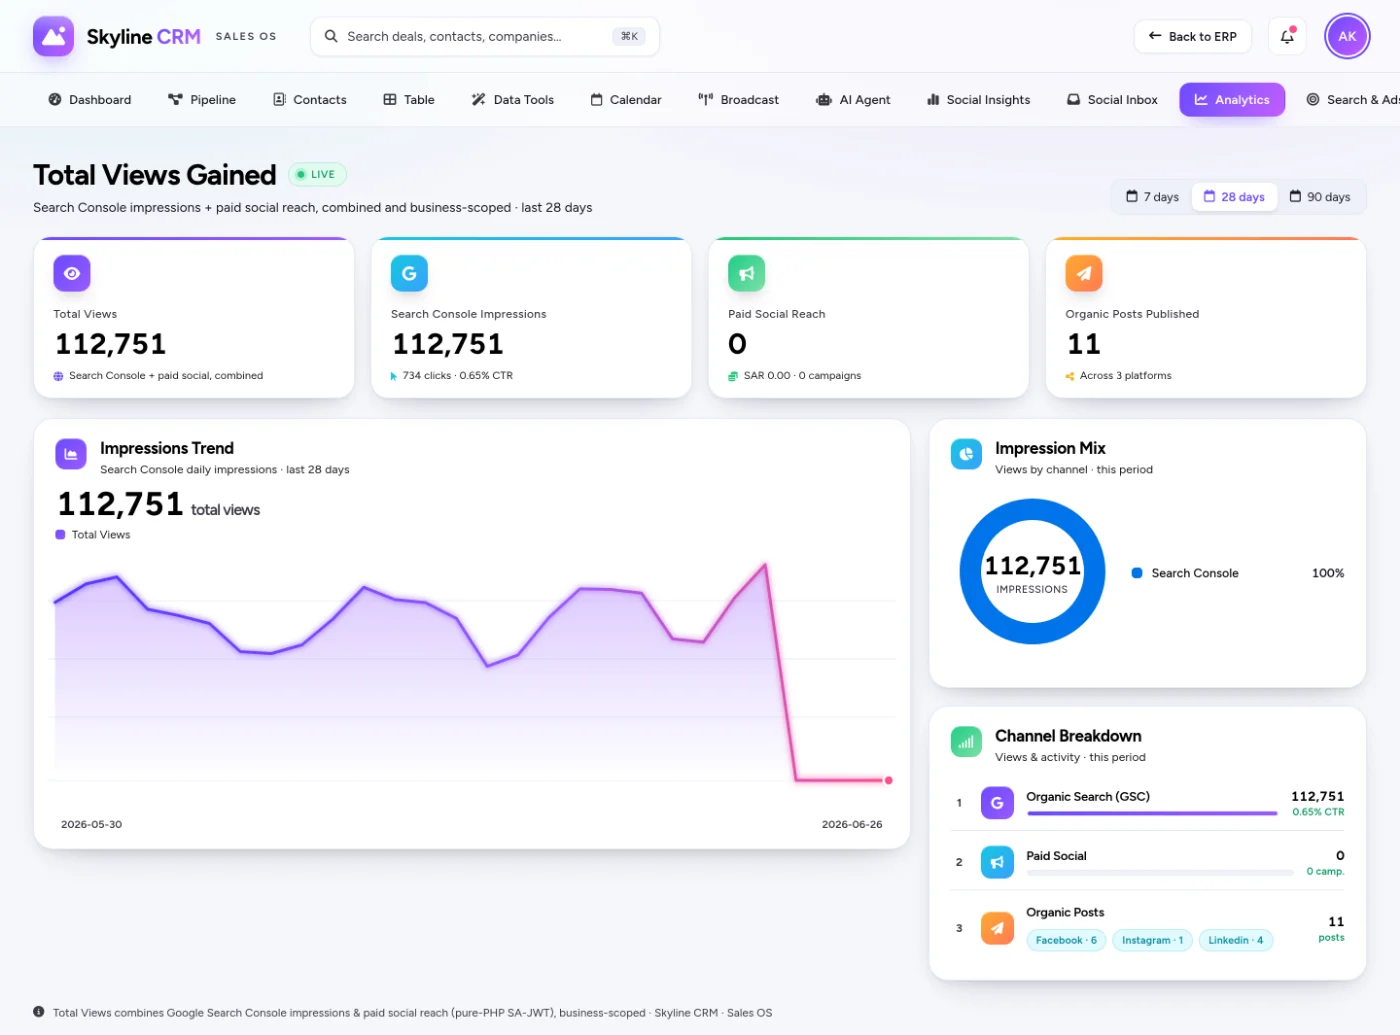
Marketing reach in the same view
Sales numbers tell you what closed; they do not tell you whether enough people are hearing about you in the first place. Skyline Sales OS pulls in Google Search Console and social reach analytics alongside the sales data, so demand and pipeline live on one screen. When the forecast softens, you can see whether the cause is downstream (conversion) or upstream (reach) — and act on the right end. This pairs naturally with the autonomous AI marketing agent, whose work shows up in the same reach numbers.
What this changes for a Saudi sales leader
A regional manager covering the GCC no longer waits for three country spreadsheets to be merged. The weighted forecast is live and consistent, attainment is visible per territory, and the leaderboard makes coaching specific instead of general — you can see that a rep's win-rate is fine but their velocity has stalled, and have a useful conversation about it. Decisions move from monthly and anecdotal to weekly and evidenced.
Turn the numbers into a weekly rhythm
Numbers only change behaviour when they are looked at on a schedule. The practical habit is a short weekly pipeline review built around three of these views: the weighted forecast (are we on track for the quarter?), conversion by stage (where are deals leaking this week?), and attainment by territory (who needs help before month-end?). Because the data is already live, the review is a conversation about what to do, not an hour spent assembling spreadsheets first. Over a quarter, that rhythm is what turns analytics from a dashboard people glance at into decisions that move the number.
Frequently asked questions
Do I have to build these reports?
No. The analytics are generated from the deals, leads and quotes already in the system. Working the pipeline produces the numbers.
What makes the forecast "weighted"?
Each deal is multiplied by its AI win-probability, so the forecast reflects likelihood rather than a raw sum of everything open.
Can I see performance by region?
Yes. Quotas and attainment are tracked by territory, so you can compare Riyadh, the Eastern Province, the Western Region and beyond.
Why include Search Console and social reach?
So demand generation and sales results sit in one view, and you can tell whether a soft forecast is a reach problem or a conversion problem.
See your real numbers
Connect a slice of your pipeline and we will show you the live funnel, the weighted forecast and attainment by territory on your own data. To arrange a walkthrough, request a Skyline Sales OS demo.
Comments
0 total · 0 threads